IMDB Ratings PT. I
This is the first in a series of posts that examines TV and the movies through the lens of Data Science.
The first step in any data science project is exploring your data. Start simple, develo an understanding of both the data and questions to ask. In this example we ask a basic question using data pulled from the Internet Movie Database (IMDB). Has the quality of “The Simpsons” degraded over the last 25 years? In later posts we will build from this question using machine learning approaches to examine the IMDB database in greater depth.
You used to be a Simpson’s fan in one graph.
The Simpson’s started in 1989. I was nine. Initially many of the jokes went over my head, but my humor matured with the show. My usual routine anticipated each new episode Sunday night at seven and subsequent deification the following day in the hallways of Conrady Jr. High. By high school the show was being rerun and watched diligently three times a day at 5, 5:30 and 10. Simpson’s knowledge became a currency, a badge of honor. By college, my dedication had waned. The episodes had lost their edge . Creativity had been lost to gimmicks. Critics and fans alike were calling for its cancellation.
“…lost to gimmicks…”
As of 1999 I knew every possible detail about the show I could tell you the entire story line from the opening seconds. Fast forward 16 years and the show still persists, but I know little of the show. Where I was a Simpson’s trivia expert its trivia now eludes me. The show has persisted so long with declining quality. The shell of the Simpson’s that persists is now more influential than Simpson’s in its prime. I am just one perspective from a generation that grew up during the Simpsons’ heyday. The show persists, they still have dedicated new and old fans who may disagree and feel that the Simpson’s are as good as ever.
Have the Simpson’s declined?
Simple answer, Yes.
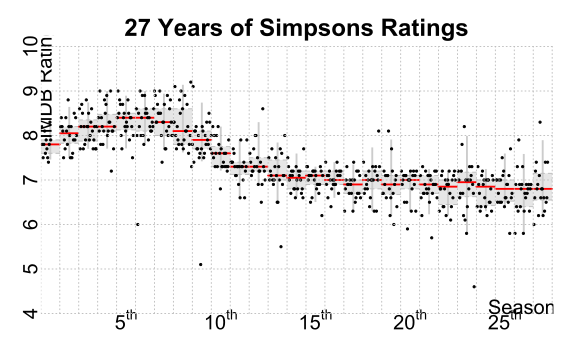
Plotting the average IMDB rating for each episode we can see a steady decline in ratings. The typically episode of the 90s received ratings above eight, but at the end of the decade a distinct decline started. As of 2002 (season 11) the typical episode rating was near seven. From then on we see a slow decline in episodes and now the best episodes are only rated as good as the worst from the 90s. That being said I assume that ratings in the 6s are above average (Turns out they arn’t. See the next Simpson’s post). That’s not terrible. The show just doesn’t have the quality it used to have. My generation of fans may ask, “When will the bleeding stop?”, but we are just one generation’s voice.