IMDB Ratings PT. II
IMDB Ratings
In the last blog we demonstrated a negative trend in Simpson’s ratings on IMDB. Ratings ranged from an average well above eight in the early 90s to below seven 26 years later. This appears to be a decline, but needs to be contextualized to the IMDB rating system. IMDB’s ratings are based on a 10 point scale. Intuition would suggest that 5.5 is average and the the remaining ratings would correspond to something like this:
| 1 | 2 | 3 | 4 | 5 | 6 | 7 | 8 | 9 | 10 |
|---|---|---|---|---|---|---|---|---|---|
| Awful | Bad | Poor | Eh | Fair | Fine | Good | Great | Amazing | Phenomenal |
That table was actually difficult to make. I understand that a 1 is worse than a 10, but its hard to find adjectives to describe each tier. This scale relies on nuance to understand the difference between Good and Poor or Fair and Fine. This scale does not make quality readily apparent. I don’t feel capable of rating at this high of precision. Researchers suggest that humans are not good at minimizing absolute error (How good is a movie between one and ten), but excel at relative error (Is a movie better than average?)1. In this sense IMDB ratings may be hard to interpret. A five star or point scale like this might be better:
| 1 | 2 | 3 | 4 | 5 |
|---|---|---|---|---|
| Bad | Poor | Average | Good | Great |
This scale simplifies the ratings process and now you can rate everything relative to the average.
IMDB’s scale may be problematic, but regardless of the rating system. We still don’t know what an IMDB rating means. Is 5.5 average? Is the data distributed normally ? Is it skewed ? Is there a trend through time ?
Lets look at the data to find out.
Histograms are a great way to summarize the distribution of data. A histogram of the IMDB data quickly shows that the mean rating is a full point higher than expected at 6.61, and the data is skewed right with the most common ratings higher near 7. This immediately calls into question how we should interpret the IMDB data. Why are ratings skewed right? Are people overly optimistic? Do we rate good movies more often than bad?
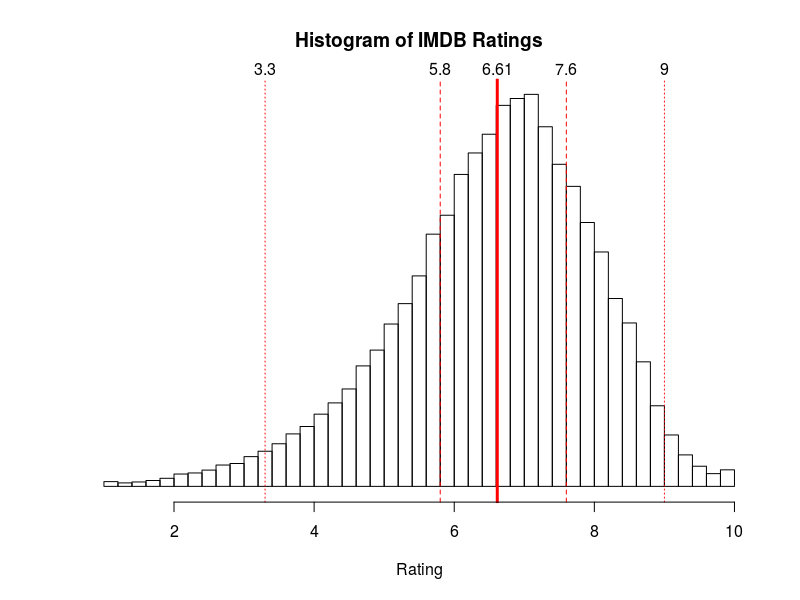
The mean, 6.61 is a full point above the expected mean of 5.5
Are ratings consistent through time?
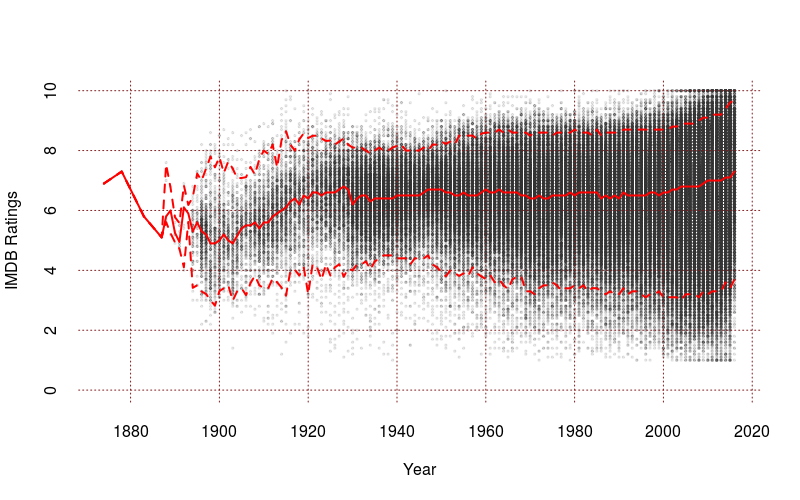
Plotting the rating through time reveals relative stability from the 1920s until the 1990s. Movies made during the silent era tend to be rated worse and over the last 20 years the average rating is improving. Also, every year the spread, also called variance $\sigma^2$, of the data is increasing. Meaning there are more bad and good movies being made.
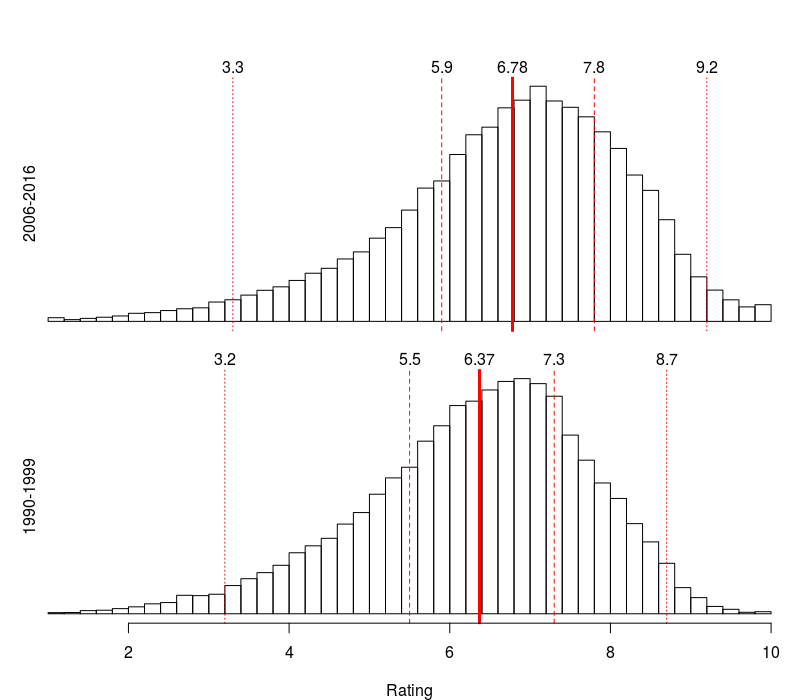
Based on the trend of increasing ratings over the last 20 years. If we return to histograms to compare the 90s with movies since 2006. A shift is obvious with median ratings growing from 6.5 in the 1990s to 7 since 2006.
Average IMDB ratings are not stationary in time nor are they balanced around an expected mean of 5.5.
Next, lets take our new understanding of the ratings system and reexamine the Simpsons.
Footnotes
-
John Z. Sun, Grace I. Wang, Vivek K Goyal, Lav R. Varshney, ‘A framework for Bayesian optimality of psychophysical laws’, Journal of Mathematical Psychology In Press, Corrected Proof DOI:10.1016/j.jmp.2012.08.002. ↩