Ranking NCAA Football
A framework for judgment
We have a sporting culture obsessed with speculating about who is number one. We want to know which team will win on any given Sunday. With the NCAA football season just starting up so too has the talk of rankings. In most sports these rankings are a trivial side-note because ultimately success will be bore out through a long season leading to inclusive playoffs. Where excluded teams are not typically contenders. NCAA football is different. Only four teams out of 128 are allowed to compete for the national championship. That is only 3%. In NCAA basketball 19% of teams qualify, while 38% of NFL teams enter the playoffs. In NCAAF the stakes are high, and with only about a dozen games against a small sample of teams determining the best teams is next to an impossible task with millions of dollars at stake.
At its core, building a model is just formalizing assumptions. Models are designed based on how we think the system might work. The goal is to create a rigorous framework that can condense a large amount of data into a simpler more interpretable format. These results provide a framework for choice to be made.
“…all models are wrong, but some are useful…” — George E. P. Box
Let’s walk-through some foundations of a model used to rank NCAA football teams:
The Model
Goal
- Rank teams in terms of who is having the best season. Not necessarily who is the best at the moment, but who has beaten the best for 12 weeks.
Assumptions
- Each team has a number that represents how good they are.
- A better team has a greater chance of beating a worse team
- The greater the score difference the greater the difference in team quality - e.g. A team of 100 will most likely beat a team of 10, by more than a team of 50.
- Similarly, each conference has its own score for quality. There are better and worse conferences.
- Home field may provide advantage
- This advantage is different for each team
- This advantage should be similar across seasons
- For simplicity in version one we assume teams do not improve or get worse throughout a season
Structure
For those who want a little math here is the simplified equation. For those who don’t just skip to the results.
This equation lays out our assumptions. It says that the that the average score of a game, $\mu$, is dependent on:
- The difference in the quality of the teams, $Quality_{Home} - Quality_{Away}$
- the difference in the quality of the conferences $Conf_{Home} - Conf_{Away}$
- how big the home team advantage is, $HomeAdv + HomeAdv_{Home}$. That gives you an average score which we know to a certain level of certainty, $\sigma^2$.
Results
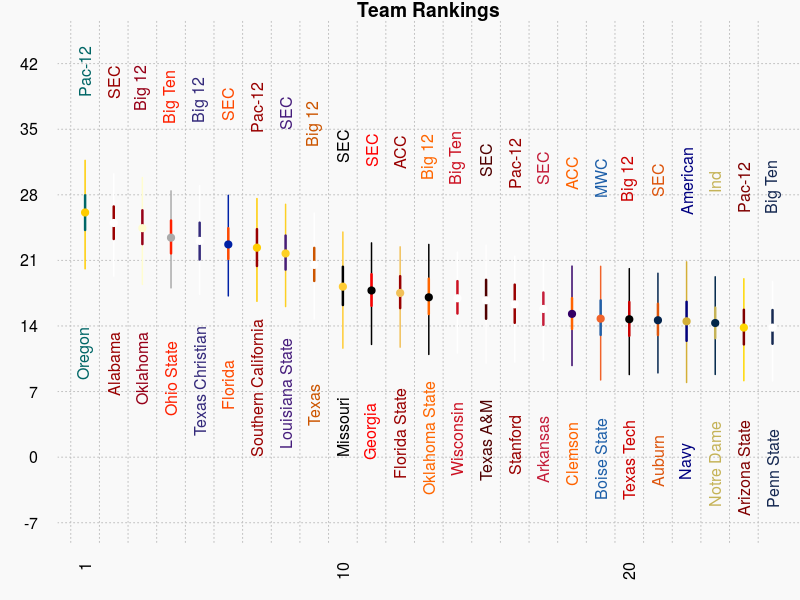
First for the fun of it. Lets apply this model for the 2005 to the 2015 season and see what programs come out ranked the best.
And the top ten are: 1.Oregon, 2.Alabama, 3.Oklahoma, 4.Ohio State, 5.TCU, 6.Florida, 7.USC, 8.LSU, 9.Texas, 10.Missouri
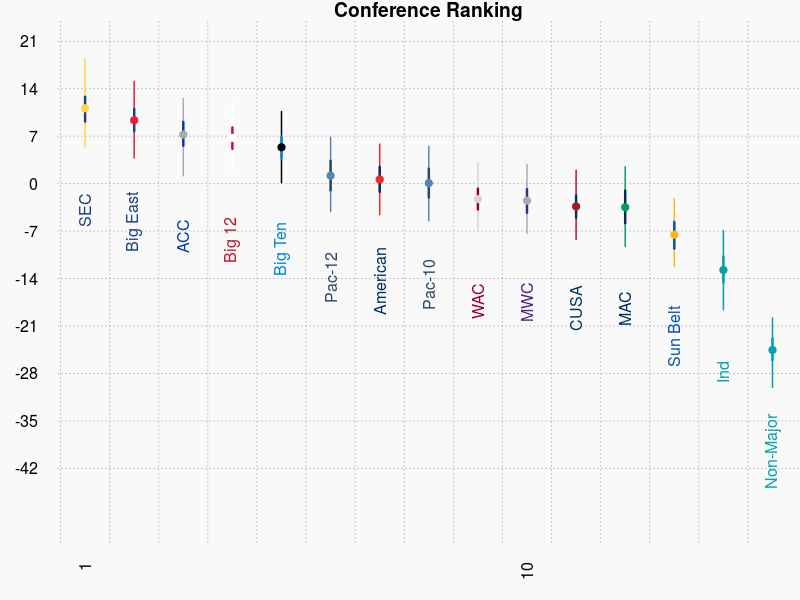
And the top conferences are:
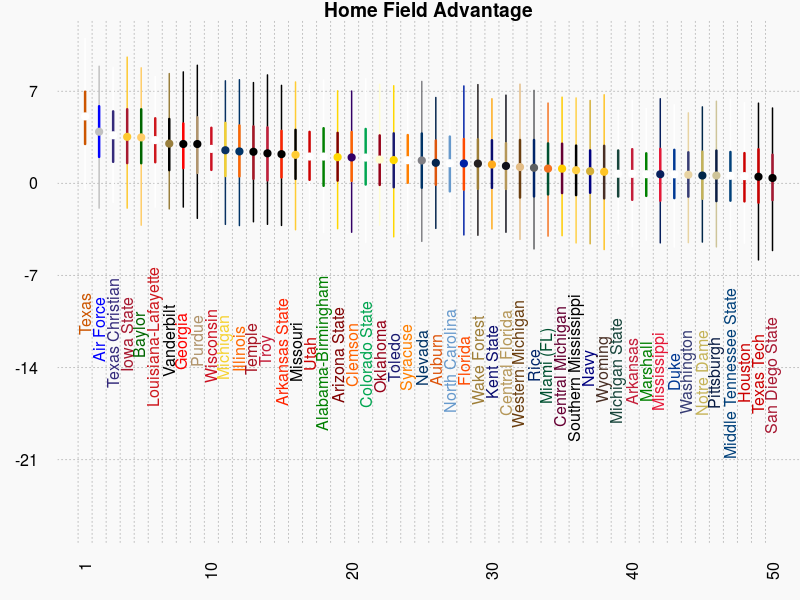
There is a lot of talk about home field advantage. We included it explicitly in the model. So now we know that Texas, the hardest place to play, has almost a touchdown advantage when playing at home.
Do these results make sense? Absolutely.
Can we argue about these results? All Day.
This model has one very clear problem with it. It is assumes that a team does not improve or deteriorate through time. We have applied it to football programs across seasons. We know that this is not a good assumption. Instead, we need to allow quality to vary through time, or we need to apply this model to shorter periods of time when quality does not vary so dramatically.
A transparent framework
Not everyone trusts a modeling approach. Many people claim they need a human touch. They value expert opinion. It is common to not trust something that you don’t understand, but modeling does not eliminate the need for experts. In fact experts use models all the time. When an expert evaluates a situation and predicts an outcome from experience they are using there own personal latent model. Its just not formalized like a statistical model is. A clear advantage of model building is that it creates a transparent framework. This minimizes bias and provides a structure where assumptions are known, and experts are pushed outside of their own ethos. Models are just tools to simplify the world and make intractable problems tractable. The formative statistician, George E. P. Box, is famous for accurately assessing models saying, “all models are wrong, but some are useful.”
In the next post we will apply this model to a more appropriate timescale the 2015 season and eventually the start of the 2016 season.